You can analyze crash dump files by using WinDbg and other Windows debuggers.
Kernel-Mode Dump Files
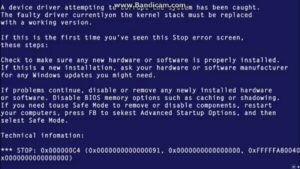
When a kernel-mode error occurs, the default behavior of Microsoft Windows is to display the blue screen with bug check data.
However, there are several alternative behaviors that can be selected:
- A kernel debugger (such as WinDbg or KD) can be contacted.
- A memory dump file can be written.
- The system can automatically reboot.
- A memory dump file can be written, and the system can automatically reboot afterwards.
This section covers how to create and analyze a kernel-mode memory dump file. There are three different varieties of crash dump files. However, it should be remembered that no dump file can ever be as useful and versatile as a live kernel debugger attached to the system that has failed.
User-Mode Dump Files
 User-mode memory dump files can be analyzed by WinDbg. The processor or Windows version that the dump file was created on does not need to match the platform on which WinDbg is being run.
Before analyzing the memory dump file, you will need to access the symbol files for the version of Windows that generated the dump file. These files will be used by the debugger you choose to use to analyze crash the dump file. For information about working with the symbol server, see see Microsoft Public Symbols..
You will also need to install all the symbol files for the user-mode process, either an application or system service, that caused the system to generate the dump file. If this code was written by you, the symbol files should have been generated when the code was compiled and linked. If this is commercial code, check on the product CD-ROM or contact the software manufacturer for these particular symbol files.
Starting WinDbg
To analyze a crash dump file, start WinDbg with the -z command-line option:
windbg -y SymbolPath -i ImagePath -z DumpFileName
The -v option (verbose mode) is also useful. For a full list of options, see WinDbg Command-Line Options.
If WinDbg is already running and is in dormant mode, you can open a crash dump by selecting the File | Open Crash Dump menu command or pressing the CTRL+D shortcut key. When the Open Crash Dump dialog box appears, enter the full path and name of the crash dump file in the File name text box, or use the dialog box to select the proper path and file name. When the proper file has been chosen, select Open.
You can also open a dump file after the debugger is running by using the .opendump (Open Dump File) command, followed with g (Go).
It is possible to debug multiple dump files at the same time. This can be done by including multiple -z switches on the command line (each followed by a different file name), or by using .opendump to add additional dump files as debugger targets. For information about how to control a multiple-target session, see Debugging Multiple Targets.
Dump files generally end with the extension .dmp or .mdmp. You can use network shares or Universal Naming Convention (UNC) file names for the memory dump file.
It is also common for dump files to be packed into a CAB file. If you specify the file name (including the .cab extension) after the -z option or as the argument to an .opendump command, the debugger can read the dump files directly out of the CAB. However, if there are multiple dump files stored in a single CAB, the debugger will only be able to read one of them. The debugger will not read any additional files from the CAB, even if they were symbol files or executables associated with the dump file.