| Previous | Next |
| SYSTEM_UNWIND_PREVIOUS_USER | INTERRUPT_UNWIND_ATTEMPTED |
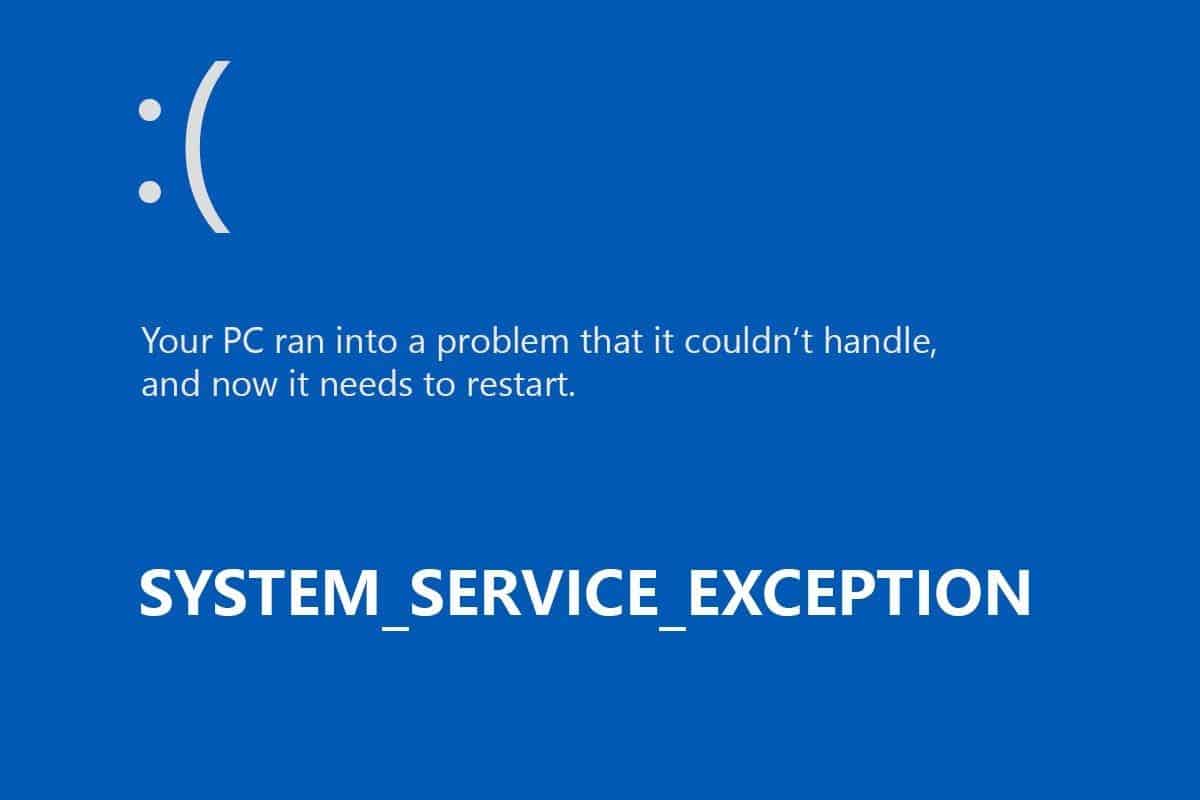
SYSTEM_SERVICE_EXCEPTION
The SYSTEM_SERVICE_EXCEPTION bug check has a value of 0x0000003B. This indicates that an exception happened while executing a routine that transitions from non-privileged code to privileged code.
Important
This topic is for programmers. If you are a customer who has received a blue screen error code while using your computer, see Troubleshoot blue screen errors.

SYSTEM_SERVICE_EXCEPTION parameters
| Parameter | Description |
|---|---|
1 |
The exception that caused the bug check. |
2 |
The address of the instruction that caused the bug check |
3 |
The address of the context record for the exception that caused the bug check |
4 |
0 |
Cause
This stop code indicates that executing code had an exception, and the thread that was below it is a system thread.
The exception information that is returned in parameter 1 is described in NTSTATUS values. The exception codes are defined in ntstatus.h, a header file provided by the Windows Driver Kit. (For more info, see Header files in the Windows Driver Kit).
Common exception codes include:
0x80000003: STATUS_BREAKPOINT
A breakpoint or ASSERT was encountered when no kernel debugger was attached to the system.
0xC0000005: STATUS_ACCESS_VIOLATION
A memory access violation occurred. (Parameter 4 of the bug check is the address that the driver attempted to access.)
Resolution
To debug this problem, use the .cxr (display context record) command with Parameter 3, and then use kb (display stack backtrace). You can also set a breakpoint in the code that precedes this stop code and attempt to single-step forward into the faulting code. Use the u, ub, uu (unassemble) commands to see the assembly program code.
The !analyze debugger extension displays information about the bug check and can be helpful in determining the root cause. The following example is output from !analyze.
SYSTEM_SERVICE_EXCEPTION (3b)
An exception happened while executing a system service routine.
Arguments:
Arg1: 00000000c0000005, Exception code that caused the bugcheck
Arg2: fffff802328375b0, Address of the instruction which caused the bugcheck
Arg3: ffff9c0a746c2330, Address of the context record for the exception that caused the bugcheck
Arg4: 0000000000000000, zero.
...
For more information about WinDbg and !analyze, see the following topics:
Using the !analyze extension
Analyzing a kernel-mode dump file with WinDbg
Identify the driver
If a driver that is responsible for the error can be identified, its name is printed on the blue screen and stored in memory at the location (PUNICODE_STRING) KiBugCheckDriver. You can use dx (display debugger object model expression), a debugger command, to display this: dx KiBugCheckDriver.
Use the !error extension to display information about the exception code in parameter 1. Following is an example of output from !error.
2: kd> !error 00000000c0000005
Error code: (NTSTATUS) 0xc0000005 (3221225477) - The instruction at 0x%p referenced memory at 0x%p. The memory could not be %s.
Look at the STACK TEXT output from WinDbg for clues about what was running when the failure occurred. If multiple dump files are available, compare their information to look for common code that is in the stack. Use debugger commands like kb (display stack backtrace) to investigate the faulting code.
Use the following command to list modules that are loaded in memory: lm t n
Use !memusage to examine the general state of the system memory. You can also use the commands !pte and !pool to examine specific areas of memory.
In the past, this error has been linked to excessive use of the paged pool, which may occur due to user-mode graphics drivers crossing over and passing bad data to the kernel code. If you suspect this is the case, use the pool options in Driver Verifier to gather additional information.
Driver Verifier
Driver Verifier is a tool that runs in real time to examine the behavior of drivers. For example, Driver Verifier checks the use of memory resources, such as memory pools. If it identifies errors in the execution of driver code, it proactively creates an exception to allow that part of the driver code to be further scrutinized. Driver Verifier Manager is built into Windows and is available on all Windows PCs.
To start Driver Verifier Manager, enter verifier at a command prompt. You can configure which drivers to verify. The code that verifies drivers adds overhead as it runs, so try to verify the smallest number of drivers possible. For more information, see Driver Verifier.
Remarks
For general troubleshooting of Windows bug check codes, follow these suggestions:
If new device drivers or system services have been added recently, try removing or updating them. Try to determine what changed in the system that caused the new bug check code to appear.
Look in Device Manager to see if any devices are marked with an exclamation point (!), which indicates a problem. Review the events log displayed in the properties for any faulting device driver. Try to update the related driver.
Check the System Log in Event Viewer for additional error messages that might help pinpoint the device or driver that is causing the error. Look for critical errors in the system log that occurred in the same time window as the blue screen.
If you recently added hardware to the system, try removing or replacing it. Or check with the manufacturer to see if any patches are available.
For additional general troubleshooting information, see Blue screen data.